Based on chaos theory, members of the ELKH-ELTE Theoretical Physics Research Group (Mátyás Herein, Tamás Tél, Tímea Haszpra) have formulated a new condition, stronger than the previously known one, for when a climate model can give a reliable, credible prediction. Based on this criterion, the authors demonstrate that models already exist that proved to be reliable over the past decades up to the present, at least for global quantities such as the global mean surface temperature of the Earth. Their paper on this has been published in the journal Chaos.
Weather and climate forecasting are nowadays carried out by means of so-called ensemble simulations. These simulations follow the same physical laws, and differ in the initial conditions only. They can evolve into a number of possible but different pathways, as is typical in all chaotic or similar systems. Research on the behavior of simple chaotic systems has shown that the ensemble faithfully describes the set of possible behaviors only after a certain time has elapsed, i.e., after the details specific to the initialization have been forgotten. Accordingly, some researchers have already pointed out that the numerical climate ensemble data can only be considered plausible after a relatively long time. Based on the results of the authors of the present paper, this can only occur when the ensemble is a “converged” ensemble. The time of convergence spans several decades after the start of the simulation. According to the authors, the question if a prediction is reliable, i.e., whether it provides data consistent with observations, can only be asked in the case of a converged ensemble.
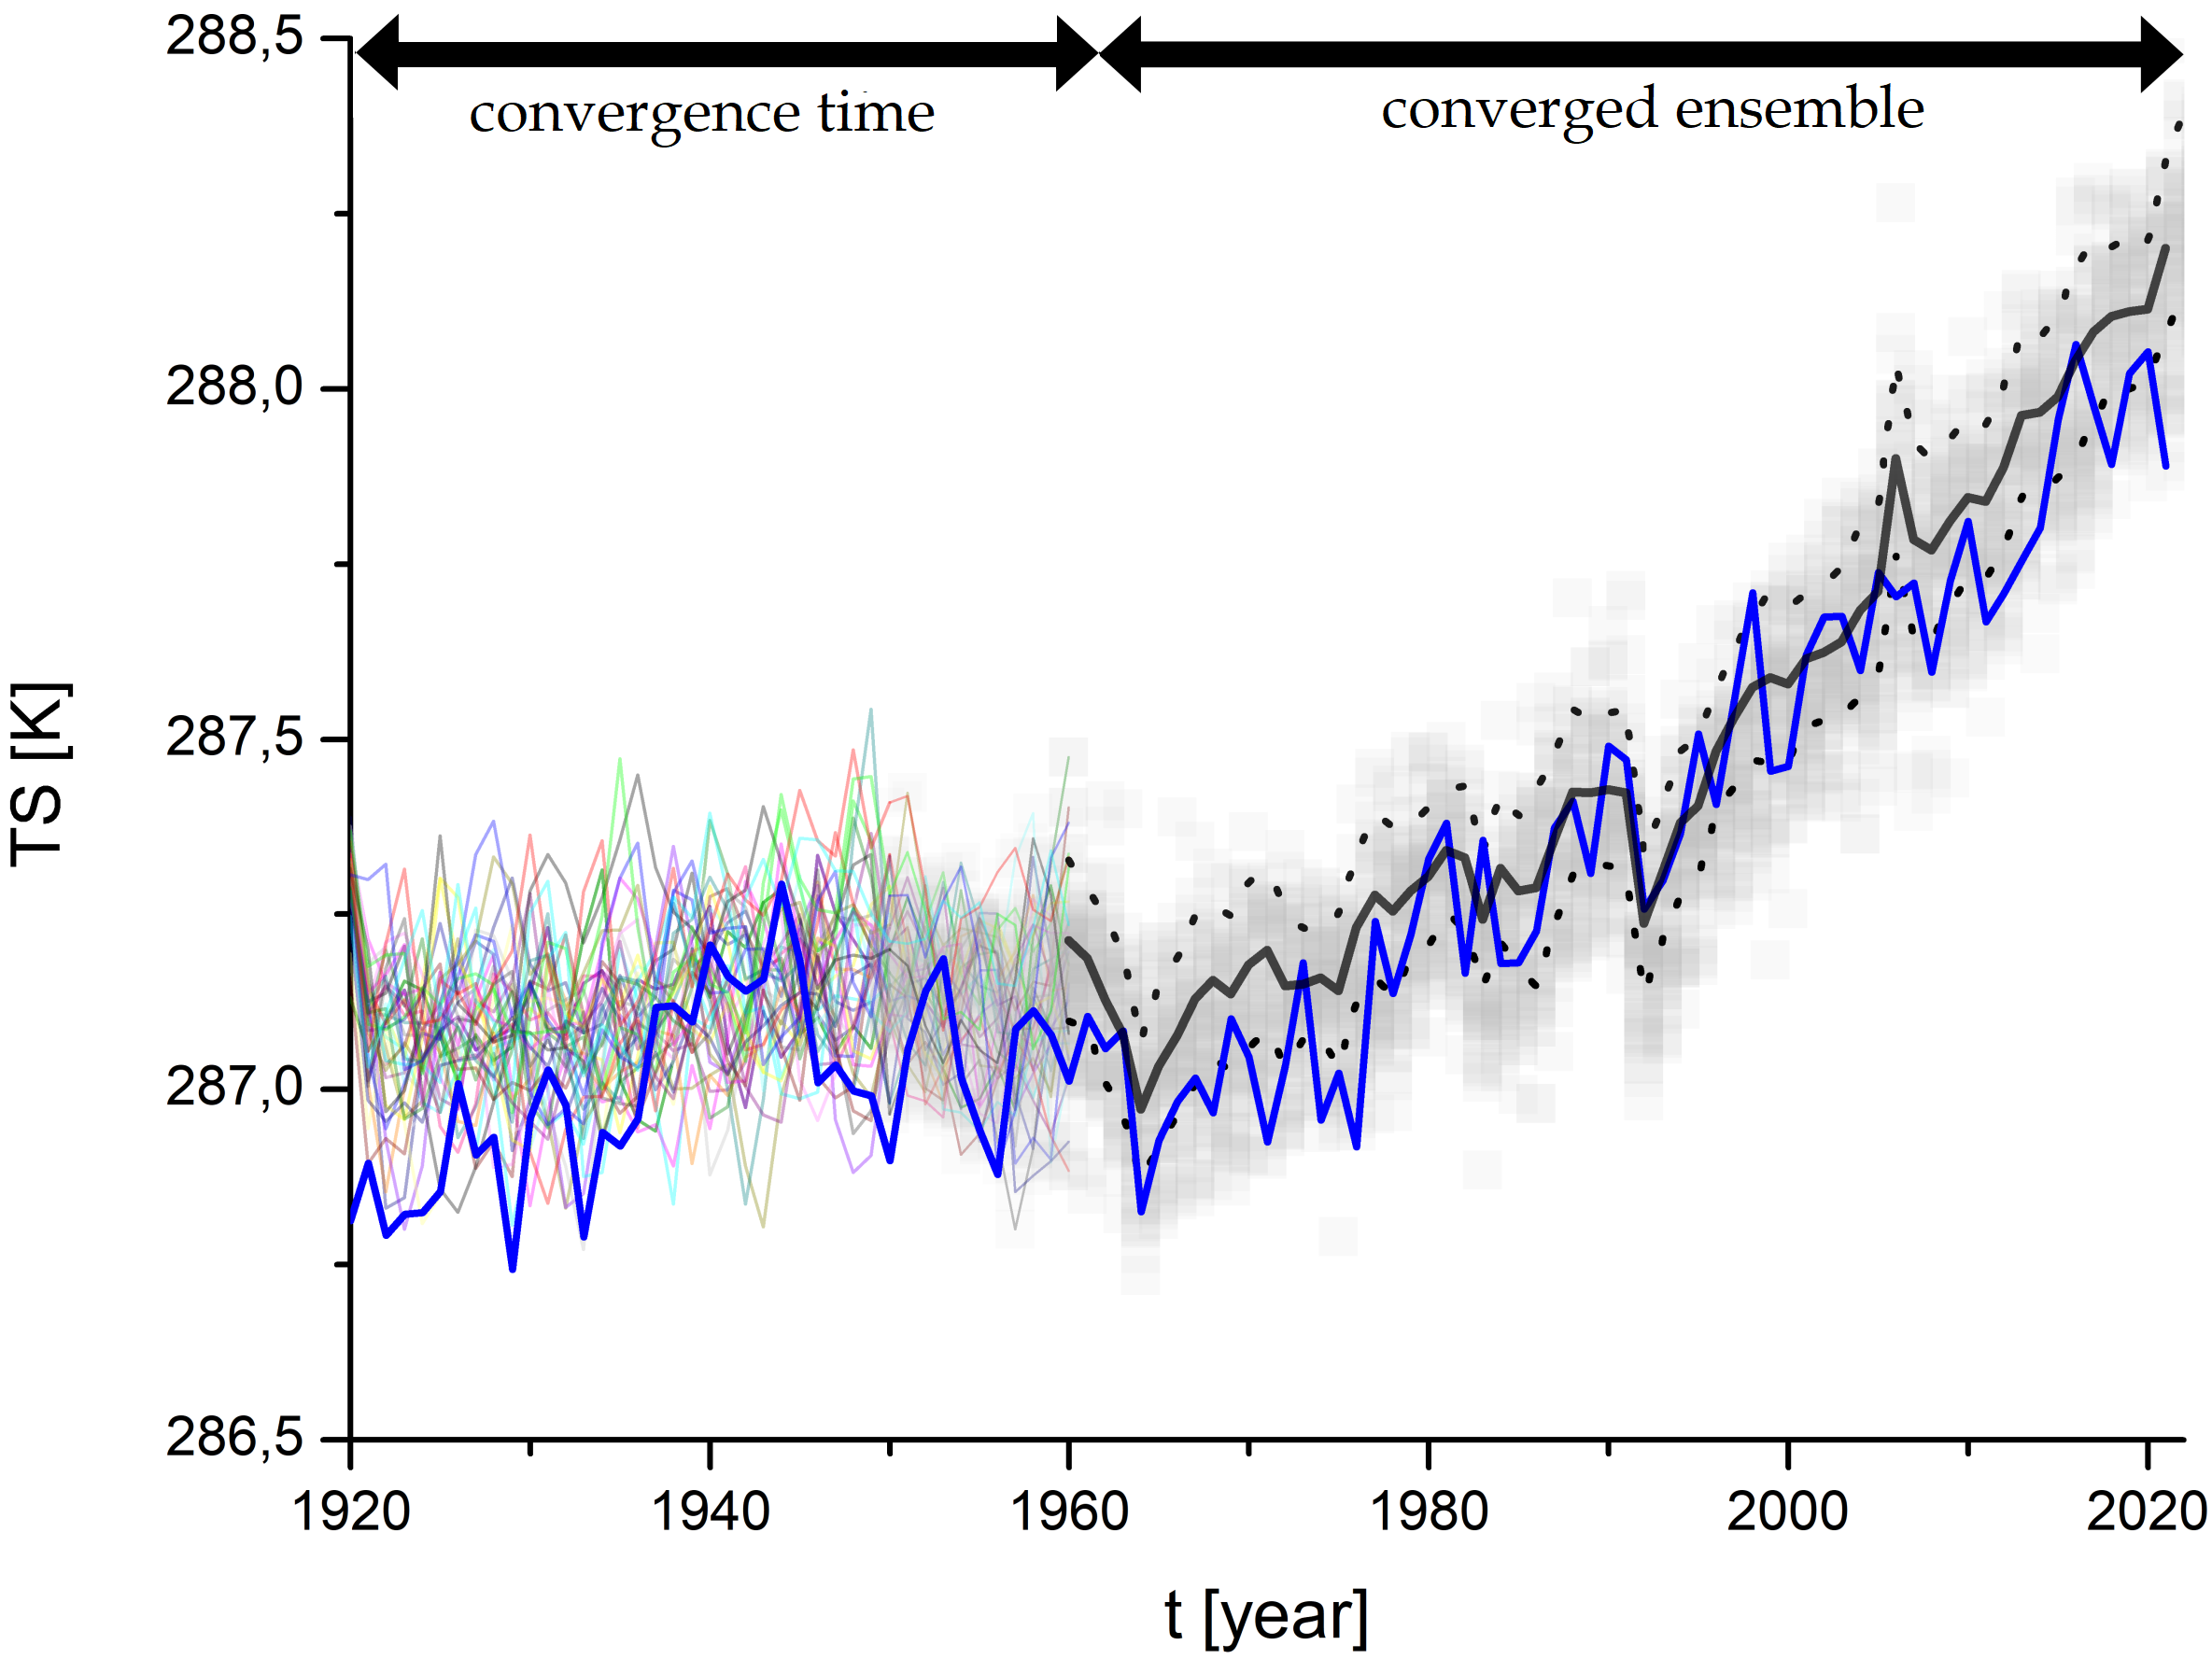
Figure 1. Results of the CESM1 climate model Large Ensemble Project ensemble simulations for the global mean surface temperatures of the Earth, denoted by TS, in 40 simulations, measured in kelvins [K] (where a unit corresponds to 1 degree Celsius). Each simulation result is shown in a different color for the 40 years before convergence is reached. In the converged range, however, when the result no longer depends on the choice of initial conditions, the possible values are shown in grey shading. In this range, the solid black curve represents the mean value of the ensemble and the dashed curves the variance around the mean. The blue curve is the measured data set of observations.
The authors express the occurrence of convergence by means of a specific graphical representation. They use data from one of the state-of-the-art climate model [CESM1-LE (Community Earth System Model ‒ Large Ensemble Project), publicly available to researchers], by conducting scientific discussions with the US team led by Dr. C. Deser, responsible for the development of CESM1-LE. As shown in Figure 1, the ensemble simulation starts in 1920 and follows 40 pathways in the global mean surface temperature (TS) variable until 2021. One of the main drivers of the model is the change in observed greenhouse gas concentrations, which follows measurements up to 2005, and a concentration prediction built into the model after 2005. The latter one matched the later (post-2005) concentration measurements with high accuracy. The authors mark the curves corresponding to the different pathways by different colors before convergence is reached, also expressing that these curves still remember the initial conditions. Once convergence has set in, only grey shading is used, since there is no point for distinction: the plethora of all the possible pathways, the converged ensemble, provides a description of the climate, which lacks any subjectivity. One can clearly observe that the grey band shows an increasing trend from about 1970 onwards, the mean surface temperature is rising, i.e., climate change is occurring.
This does not mean necessarily that the model is reliable, i.e., that it reflects the actual climate change. One should also compare the obtained data with observed values based on mean surface temperature measurements. This can be done by observing the blue curve in Figure 1, which shows one of the measured data sets (the others deviate from this very slightly). It seems reassuring that the blue curve falls into the grey band, at least after convergence set in 1960. It is worth noting, however, that the blue curve does not run in the middle of the grey band. Based on the properties of chaos, the stronger condition of the reliability of the prediction, is that the (single) curve of the measured data traverses the full width of the grey band of the converged ensemble. For a reliable prediction, the measured data set should behave like one of the pathways of the converged ensemble, but the individual unpredictability of chaos makes it impossible to predict which one. Thus, the model presented here reflects reality in the investigated variable up to 2005 and predicts it in a reliable way for the decade and a half afterwards. The authors emphasize that Figure 1, which illustrates the change merely in the variable TS, provides only a necessary condition for reliability. All relevant global quantities (e.g. ice cover) should also show such agreement for full reliability.
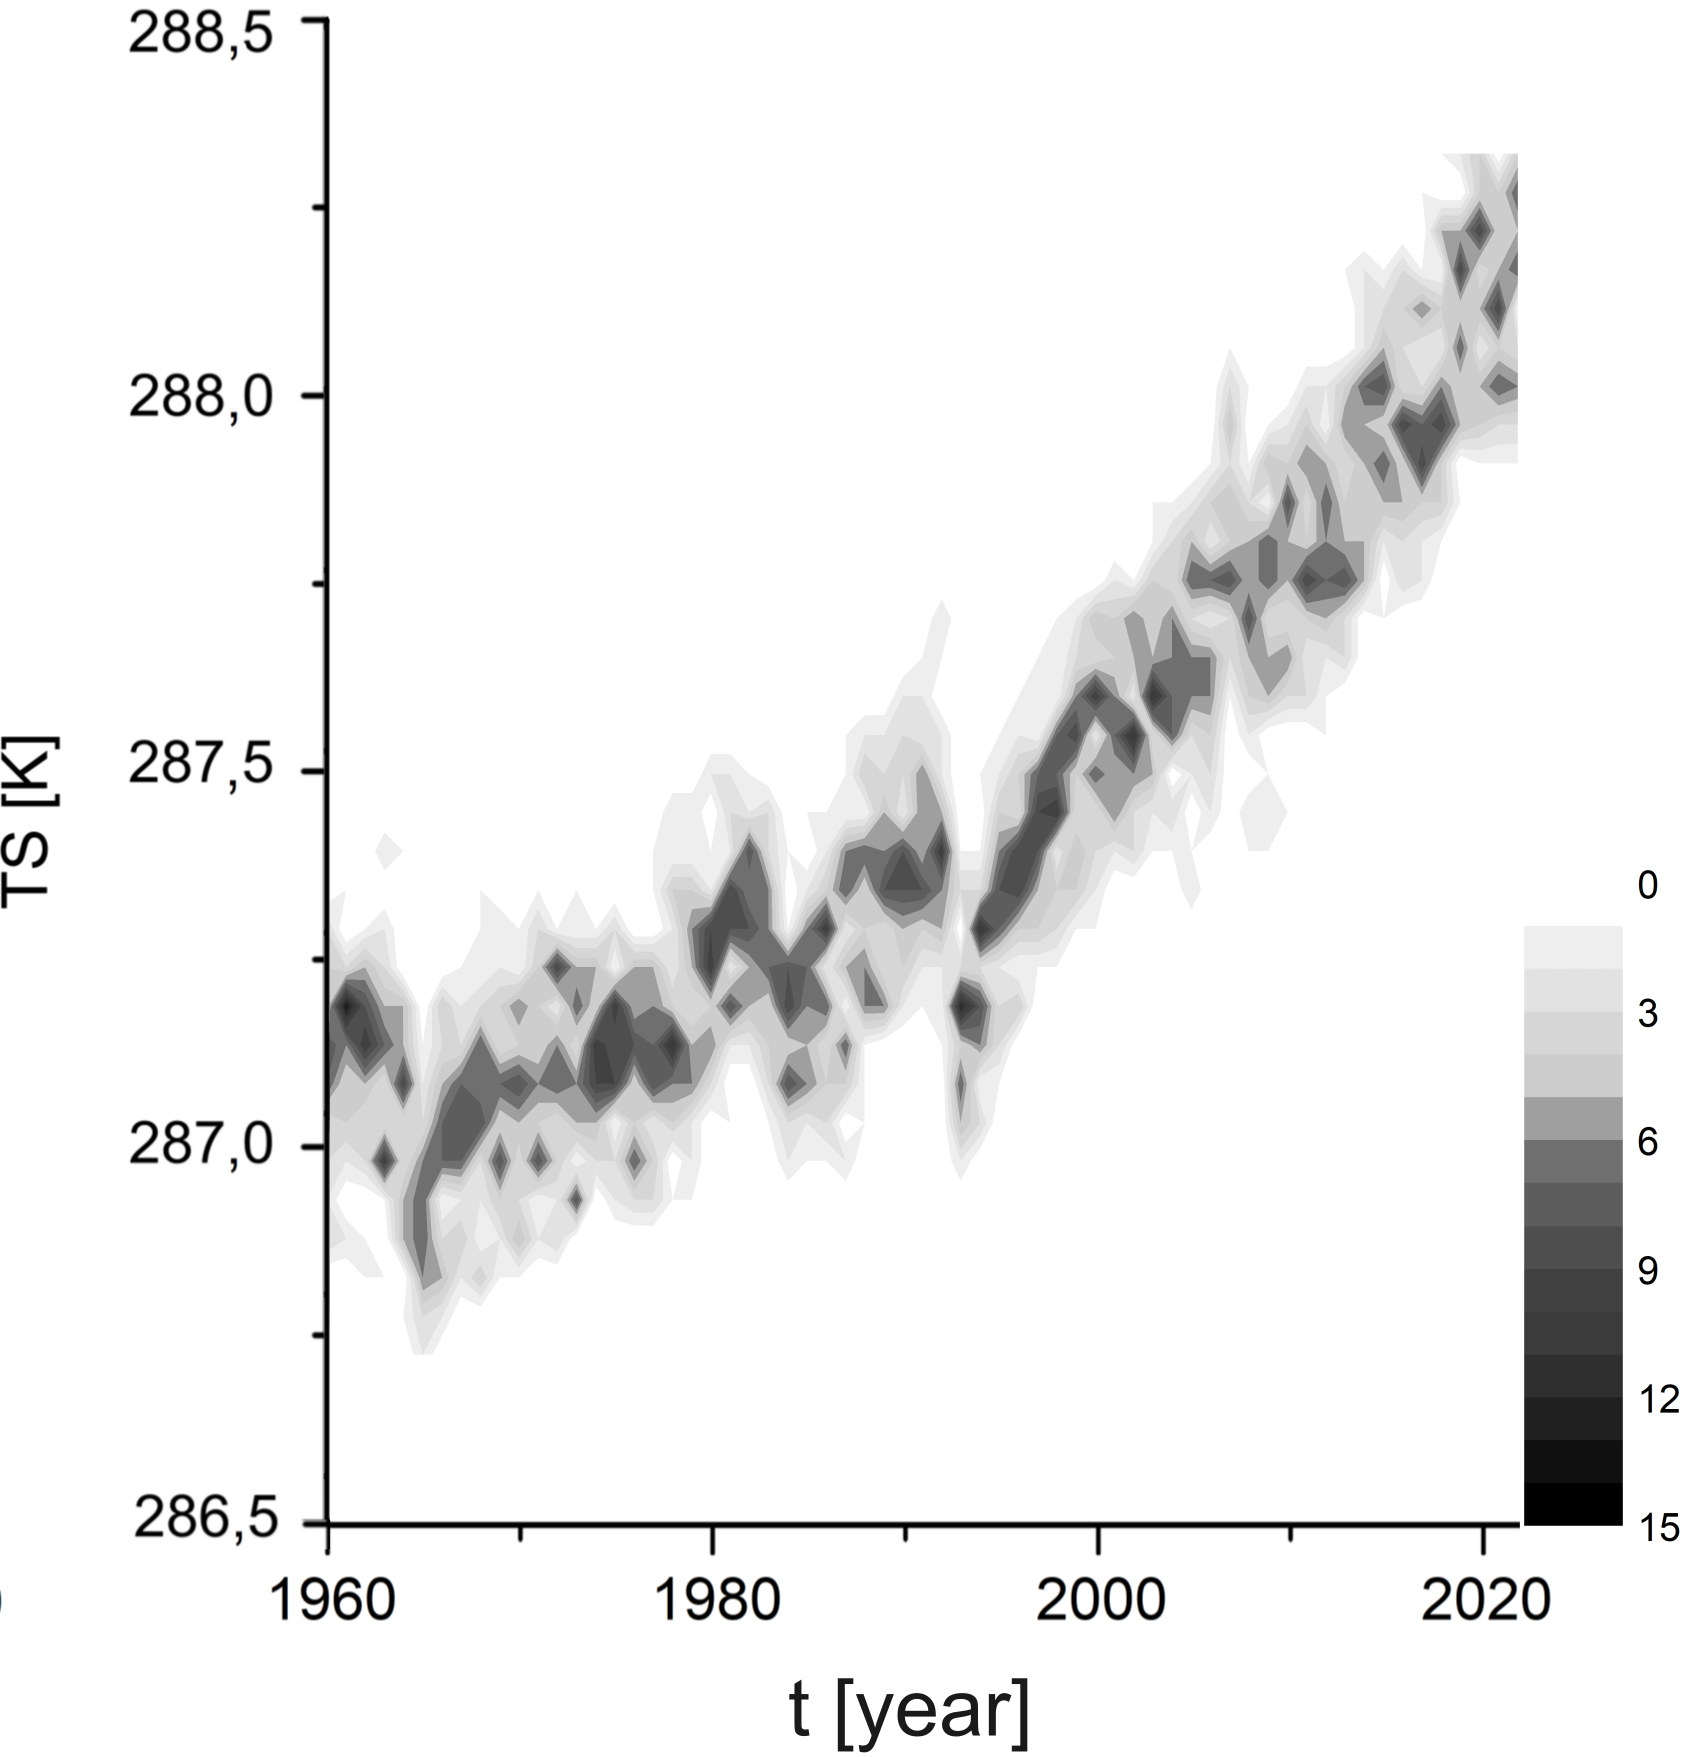
Figure 2. The frequency of occurrence of the TS values in the converged 40-element ensemble is given in grey for each year, with the color code indicating the frequency intervals used.
The distribution shown in Figure 2 is proportional to the probability of finding the possible temperature values (falling within a range of about 1 degree), black is the most likely. Thus, as in any chaotic system, in climate dynamics too, the prediction can be completely accurate in a probabilistic sense, and ensemble simulations are what make this accessible. The conceptual background of such simulations, the theory of parallel climate realizations was explored in an earlier paper with the participation of the authors, who now add that Figure 2 reflects the probability of finding the possible temperature values in the different parallel climates.